Rainbow Springs
Health & Science
Although Rainbow Springs is celebrated for its water clarity and support of a diverse array of plants and wildlife, it has been significantly impacted by residential, commercial and agricultural development in the springshed over the last 20 years.
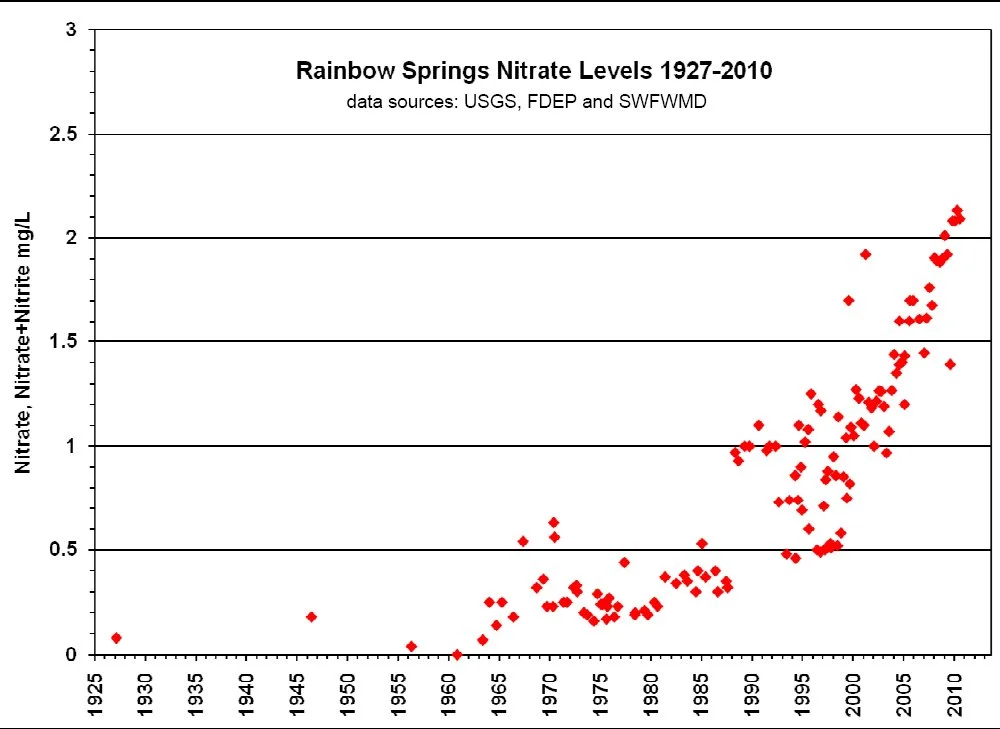
The most significant impact is the growth of nitrates that are embedded in the water that flows from Rainbow Spring’s vents. The nitrate growth has been documented on a regular basis by FDEP and Southwest Florida Water Management District scientists.
The most recent measurements are over 2 mg per liter which is well above the acceptable level of 0.35 mg/l. The high levels of nitrates have led to increased algae growth and have impacted normal aquatic vegetation and the fish and benthic organisms that use the submerged and emergent vegetation as their nursery for specie growth.
-
This chart shows nitrate and nitrite concentrations in Rainbow Springs from 1927 to 2010, measured in milligrams per liter.
The data is presented as a scatter plot, with time on the horizontal axis and concentration levels on the vertical axis.
Early measurements from the mid-1900s show very low concentrations, generally near zero. Beginning in the 1960s and 1970s, levels begin to rise gradually.
From the 1990s through 2010, concentrations increase more sharply, with many measurements reaching between approximately 1.0 and 2.2 milligrams per liter.
Overall, the chart shows a clear upward trend in nitrate and nitrite levels over time.
Data sources include the U.S. Geological Survey (USGS), Florida Department of Environmental Protection (FDEP), and Southwest Florida Water Management District (SWFWMD).
Water transparency along the springs and river length has been reduced and the productive growth of native aquatic vegetation has diminished. This has accelerated the intrusion of invasive algae. The Florida Department of Environmental Protection completed their study in January 2013 and declared Rainbow Springs and the Rainbow River impaired. DEP is initiating a program to reduce the Nitrate levels in Rainbow Springs by 82 percent. Development of the Basin Management Action Plan (BMAP) will be initiated in the first half of 2013.
-
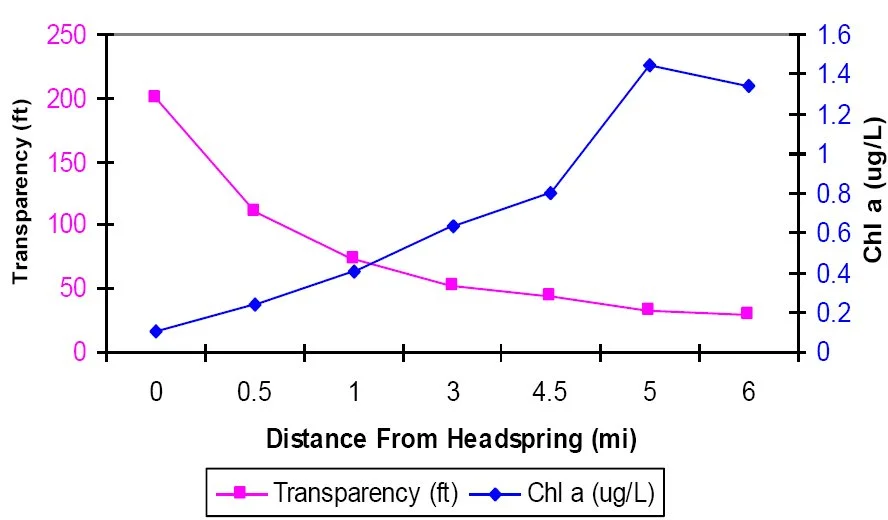
This chart shows changes in water transparency and chlorophyll a levels along the Rainbow River as distance increases from the headspring.
The horizontal axis represents distance from the headspring in miles. The left vertical axis shows water transparency in feet, and the right vertical axis shows chlorophyll a concentration in micrograms per liter.
Two lines are shown: water transparency decreases steadily as distance increases, dropping from about 200 feet near the headspring to around 30 feet at 6 miles downstream.
In contrast, chlorophyll a levels increase along the river, rising from low levels near the headspring to higher concentrations farther downstream, peaking around 5 miles before slightly declining.
Overall, the chart shows an inverse relationship between water clarity and chlorophyll levels as the river flows away from the spring source.
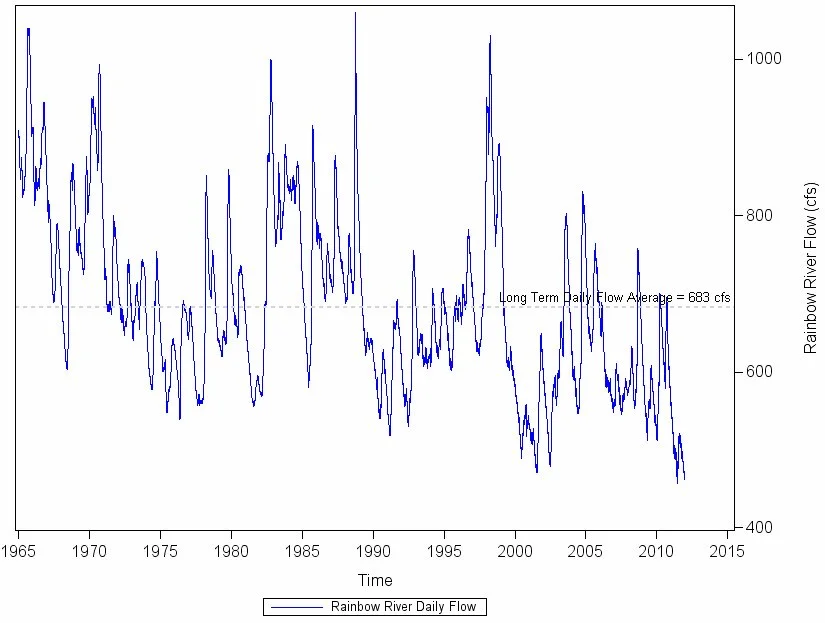
Another challenge to the heath of Rainbow Springs is the reduced flow rate of water emitting from the springs over the last several decades. Although there are wet years and dry years in the short term, that data collected by USGS shows that there is a long term trend of less flow from the spring vents.
There are two logical causes for this reduced flow:
1: Pumping from residential, agricultural and public supply wells, and
2: Lowered rainfall over time. Although it is likely that both have contributed, only the first can be impacted by private property owners and public policy over the next decade.
-
This chart shows Rainbow River flow over time, measured in cubic feet per second (cfs), from the mid-1960s to around 2015.
The horizontal axis represents time, and the vertical axis shows river flow levels. A dashed horizontal line marks the long-term daily flow average of approximately 683 cfs.
The data fluctuates significantly over time, with periods of higher and lower flow. Earlier decades show more frequent higher peaks, while later years show more frequent lower values.
In the years after 2000, flow levels are often below the long-term average, with several extended periods of reduced flow.
Overall, the chart suggests a pattern of variability with a general trend toward lower river flow in more recent years.
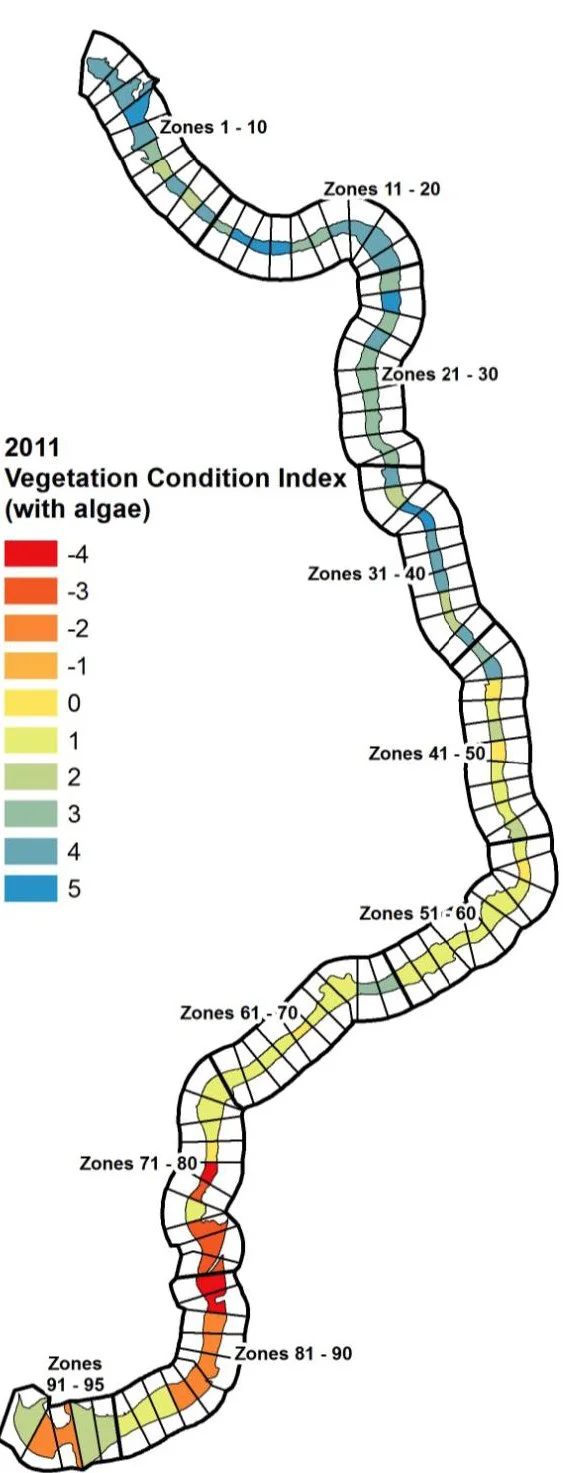
Rainbow Springs and the Rainbow River have been studied over several decades through a number of projects funded by the SWFWMD. Debora C. Woithe and her team have performed a recurring study of vegetation in the Rainbow River by dividing the river into 100 meter segments and documenting the vegetation present in each of the 91 Sections of the River. The chart at the right shows how algae has encroached up the river and now has a significant presence over half of the river.
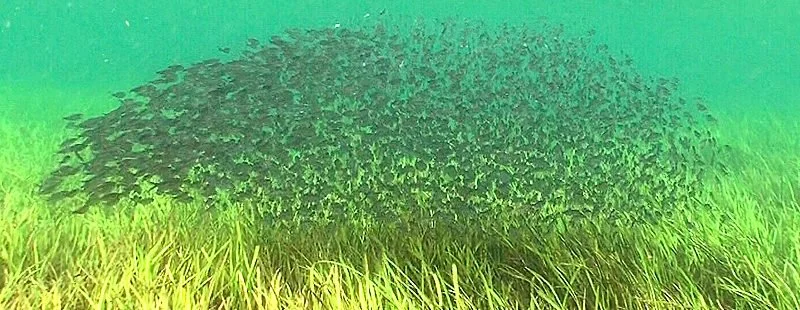
Despite the impairment and algae growth, life is vigorous and one can still see magical moments when visiting Rainbow Springs and the Rainbow River.
(1) Restoration Plan for the Rainbow Springs and River Draft, June 2011, Normandeau Associates
(2) 2011 Rainbow River Vegetation Evaluation, June 2012, Atkins North America Inc. and Debra Childs Woithe, Inc.
-
This diagram shows the 2011 vegetation condition index for the Rainbow River, divided into zones along its length.
Each section of the river is color-coded to represent vegetation condition, with values ranging from negative (poor condition, shown in red and orange) to positive (healthier condition, shown in greens and blues).
Upstream sections of the river, near the headsprings, show mostly healthier conditions with higher index values.
As the river progresses downstream, more sections shift to yellow, orange, and red, indicating declining vegetation health and increased algae presence.
The lower portion of the river shows the most degraded conditions, with multiple zones in red and orange.
Overall, the diagram illustrates that algae and declining vegetation conditions affect a significant portion of the river, particularly in downstream areas.
Learn more about Rainbow Springs
-
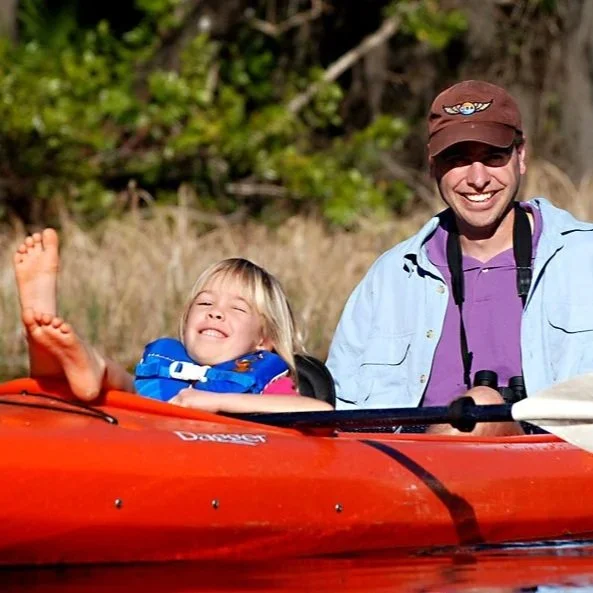
![Child reclining and smiling in a red kayak while an adult sits behind them on calm water]()
Why We Love This Spring
Rainbow Springs gathers wildlife and people at its clear, steady headwaters, where 72 degree water flows year round. It is a place of refreshment, magnificent beauty, and quiet recreation.
-
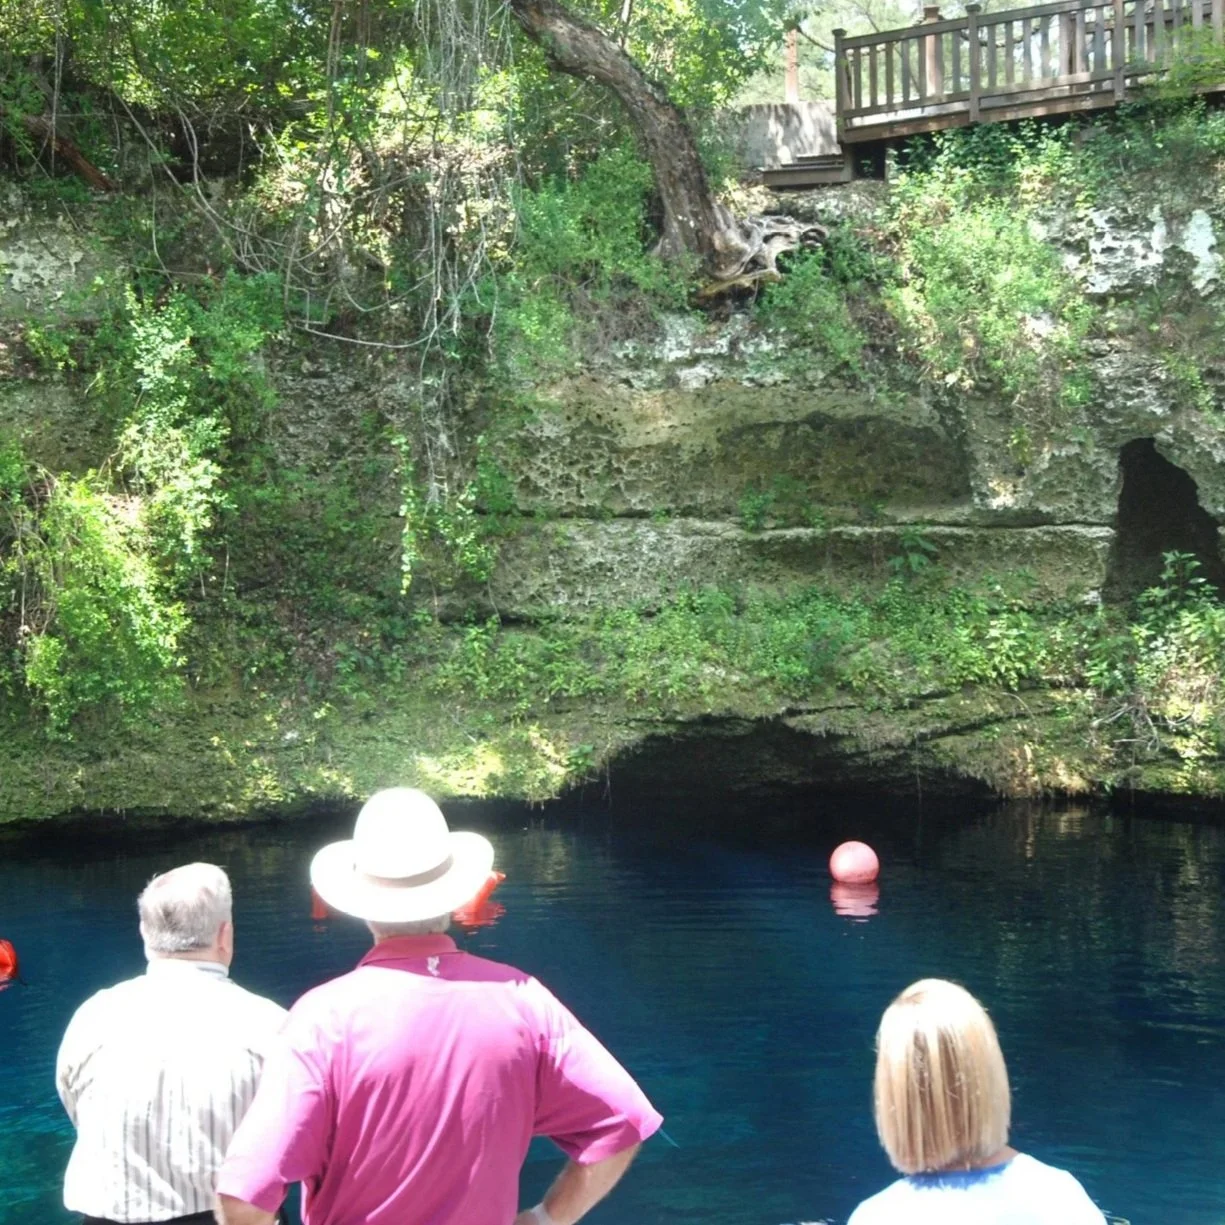
![Three people standing at the edge of a clear blue spring, looking into the water beneath a wooden overlook]()
Know Your Springshed
Discover how Rainbow Springs is formed by multiple spring vents rising through Florida’s karst limestone. Its flow depends on a vast recharge area that feeds the aquifer beneath.
-
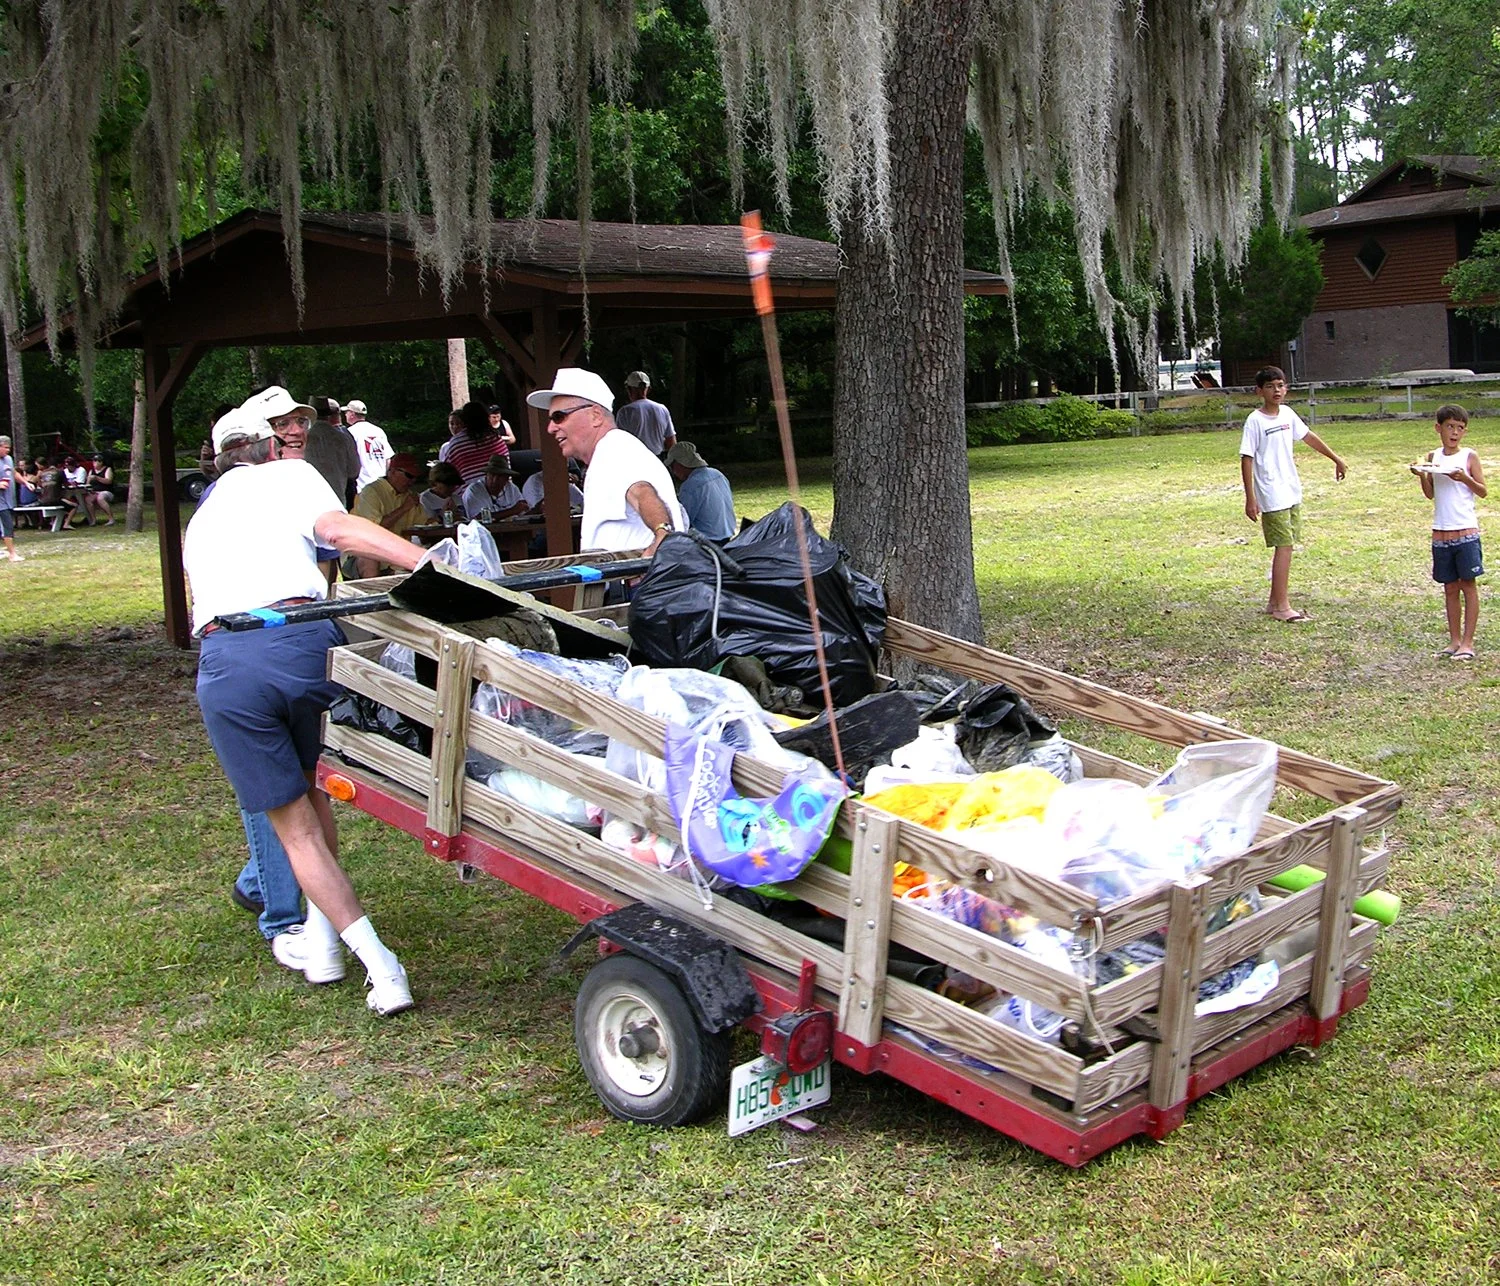
![People loading bags of collected trash onto a small trailer during a community cleanup under trees]()
Caring for Your Spring
Rainbow Springs is protected through state oversight and active local stewardship. Volunteers and nonprofits lead cleanups, habitat restoration, and education to care for the river.
-
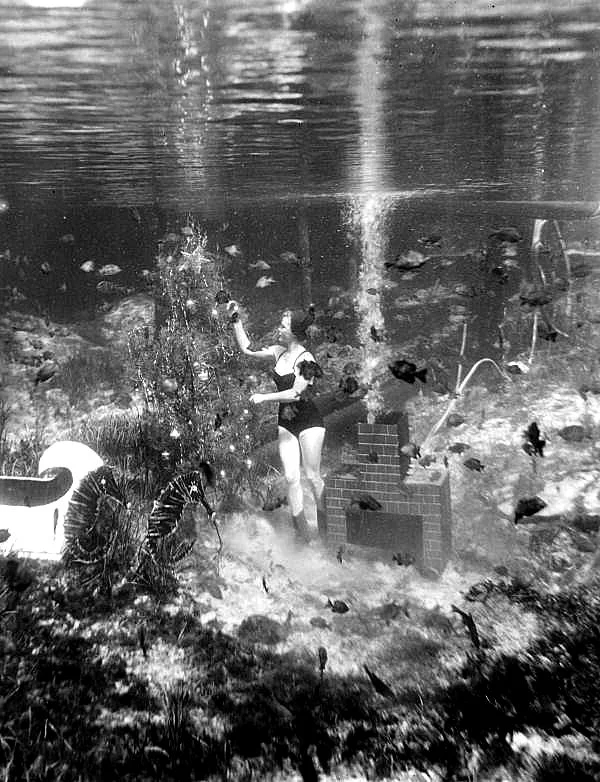
![Black and white underwater photo of swimmers surrounded by fish in a spring]()
History
Rainbow Springs has drawn people for thousands of years, leaving traces of early settlement along its clear waters. Its history continues to unfold with each generation that gathers at its headwaters.
-
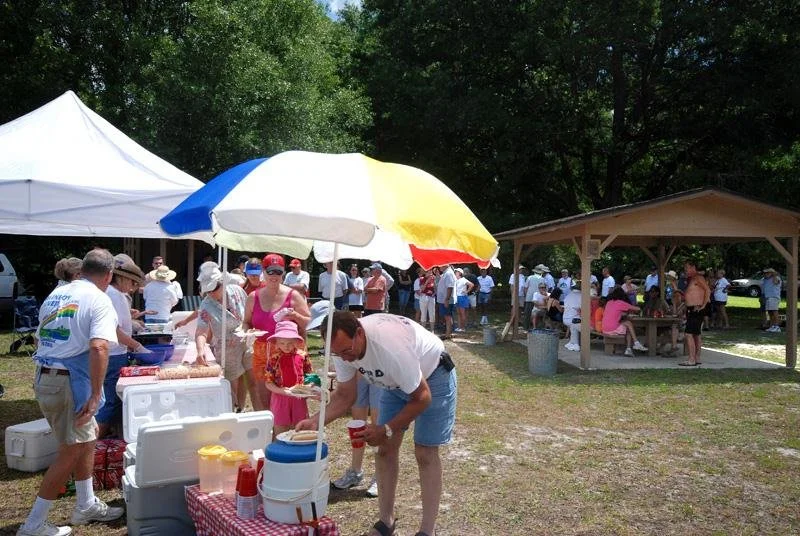
![Crowd gathered at a park pavilion during a community event with people serving drinks]()
News, Events & Public Policy
Volunteers unite for the annual Rainbow River Cleanup, collecting trash by boat, kayak, and canoe. The day ends with awards and a community picnic celebrating stewardship.
-
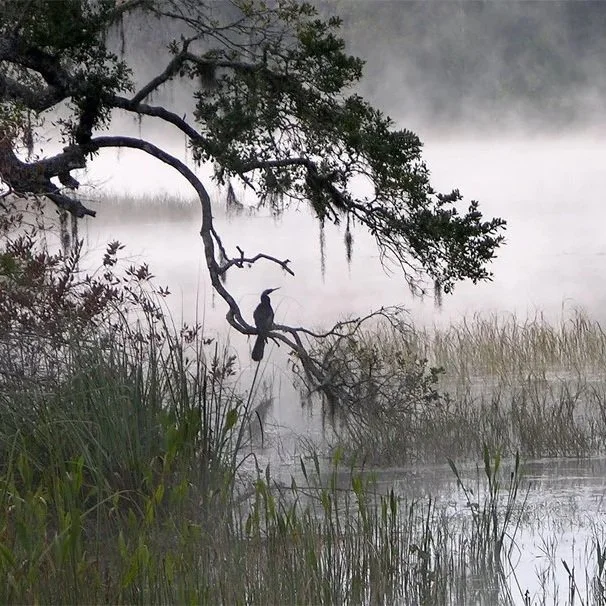
![Misty river scene with a bird perched on a tree branch over the water]()
Groups, Organizations & Resources
Find contacts and research documents related to Rainbow Springs protection and conservation. These are some of the resources that support ongoing restoration and management efforts.
-
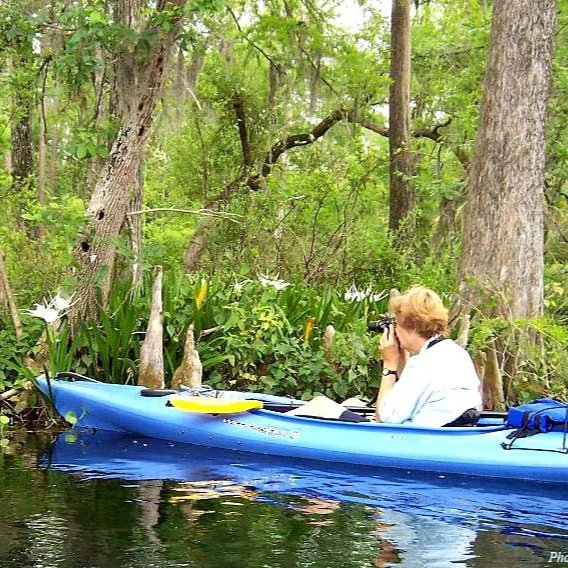
![Sandra Marraffino photographing from a blue kayak on the Rainbow River]()
About Your Moderator
Paul and Sandra Marraffino moved to Dunnellon after being inspired by Rainbow Springs and all its splendor. Sandra now focuses on bird research and conservation in the region.